This opens Dissecting Binaries with machine-code-analyzer, a series where I point the tool at real binaries and write up what falls out.
I keep asking small questions about binaries and never having a quick way to
answer them. How big is the average function in this program? How much of it
is cold error handling that almost never runs? Does it use SIMD at all? Was
it built with the stack protector? readelf, objdump and nm all know
pieces of the answer, but stitching them together by hand gets old fast.
So I wrote a tool for it: machine-code-analyzer. It takes
one ELF binary, disassembles it with capstone,
reads the ELF structure with pyelftools,
and prints answers. It is a single Python script, one subcommand per
question. Nothing here needs source code or debug builds; it works on the
stripped binaries already sitting in /usr/bin.
Every example below runs against /usr/bin/python3, the interpreter on my
machine. It is a good specimen: large, real, and full of the patterns a
compiler leaves behind.
$ ./machine-code-analyzer.py <module> [<options>] <binary>
Where the Code Lives
The function module reads the symbol table and reports the size of every
function, straight from the ELF st_size, so the numbers match readelf -s
exactly. Alignment padding between functions is not counted against anyone.
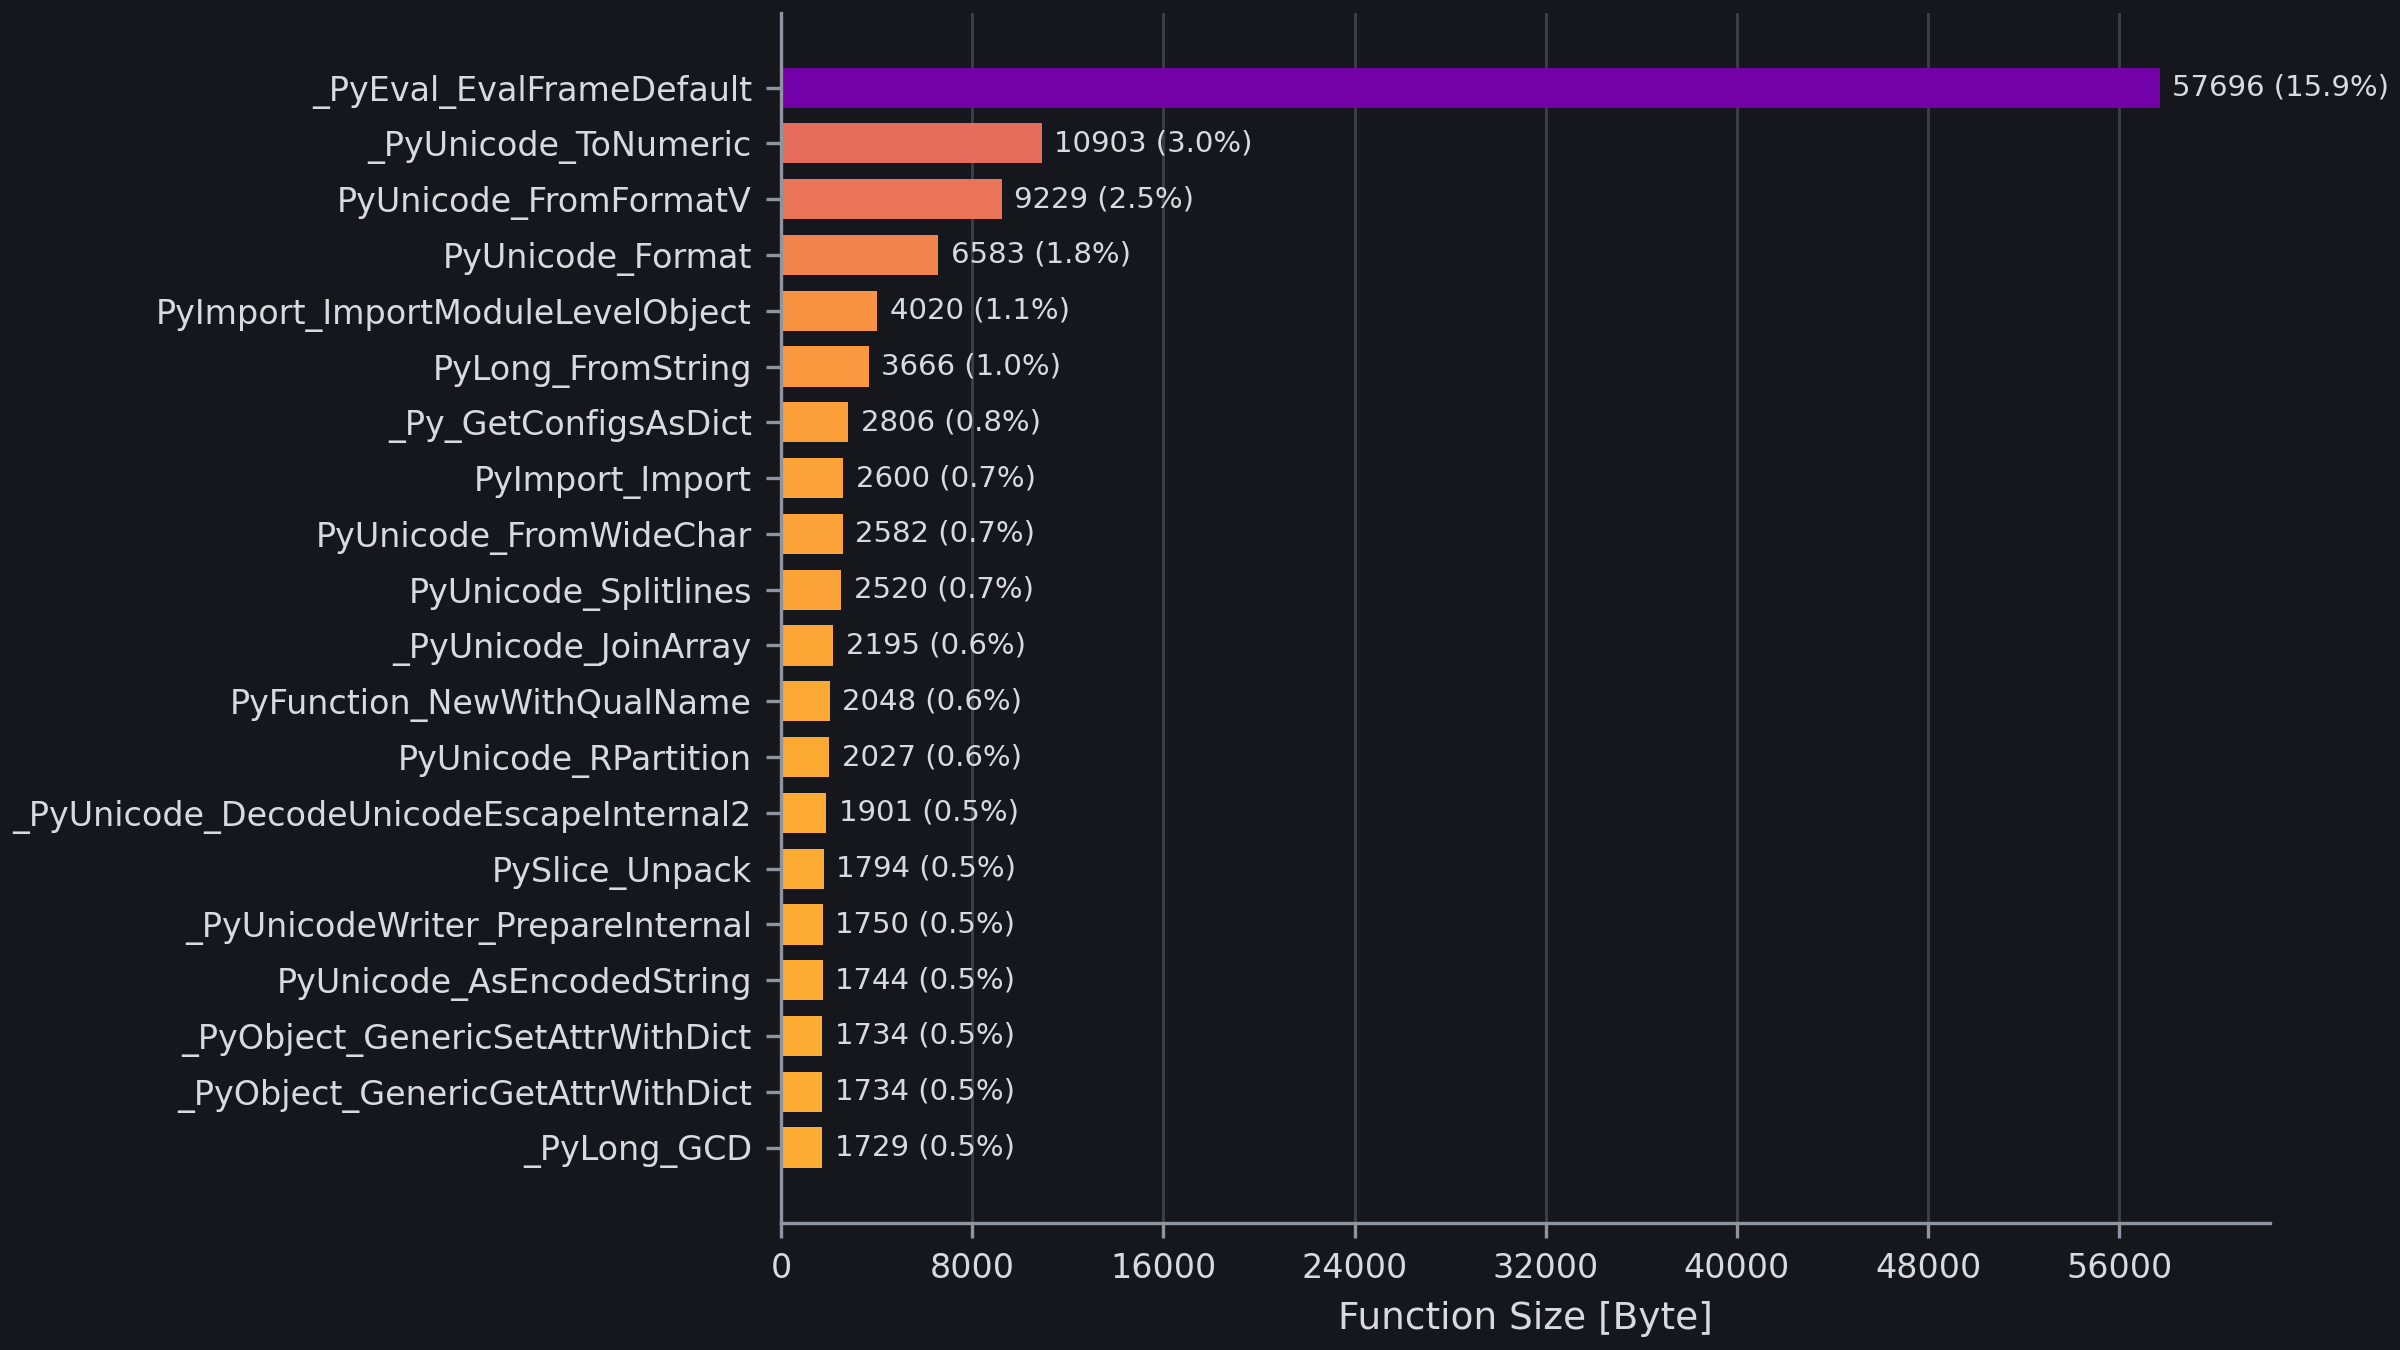
The twenty largest functions in python3. One function, the bytecode interpreter, dwarfs everything else.
python3 has about 1500 functions, and one of them is a monster.
_PyEval_EvalFrameDefault is 57 KB of a single function, the loop that
executes CPython bytecode. A handful of large functions like this carry most
of the code; the long tail is small helpers of a few hundred bytes. That
shape, a few giants and a swarm of small functions, is what nearly every
non-trivial binary looks like once you measure it.
What the Instructions Are
The instruction module decodes everything and groups it. Mnemonics are
reported in AT&T syntax with the size suffix, the way objdump shows them,
and each one is put into a category.
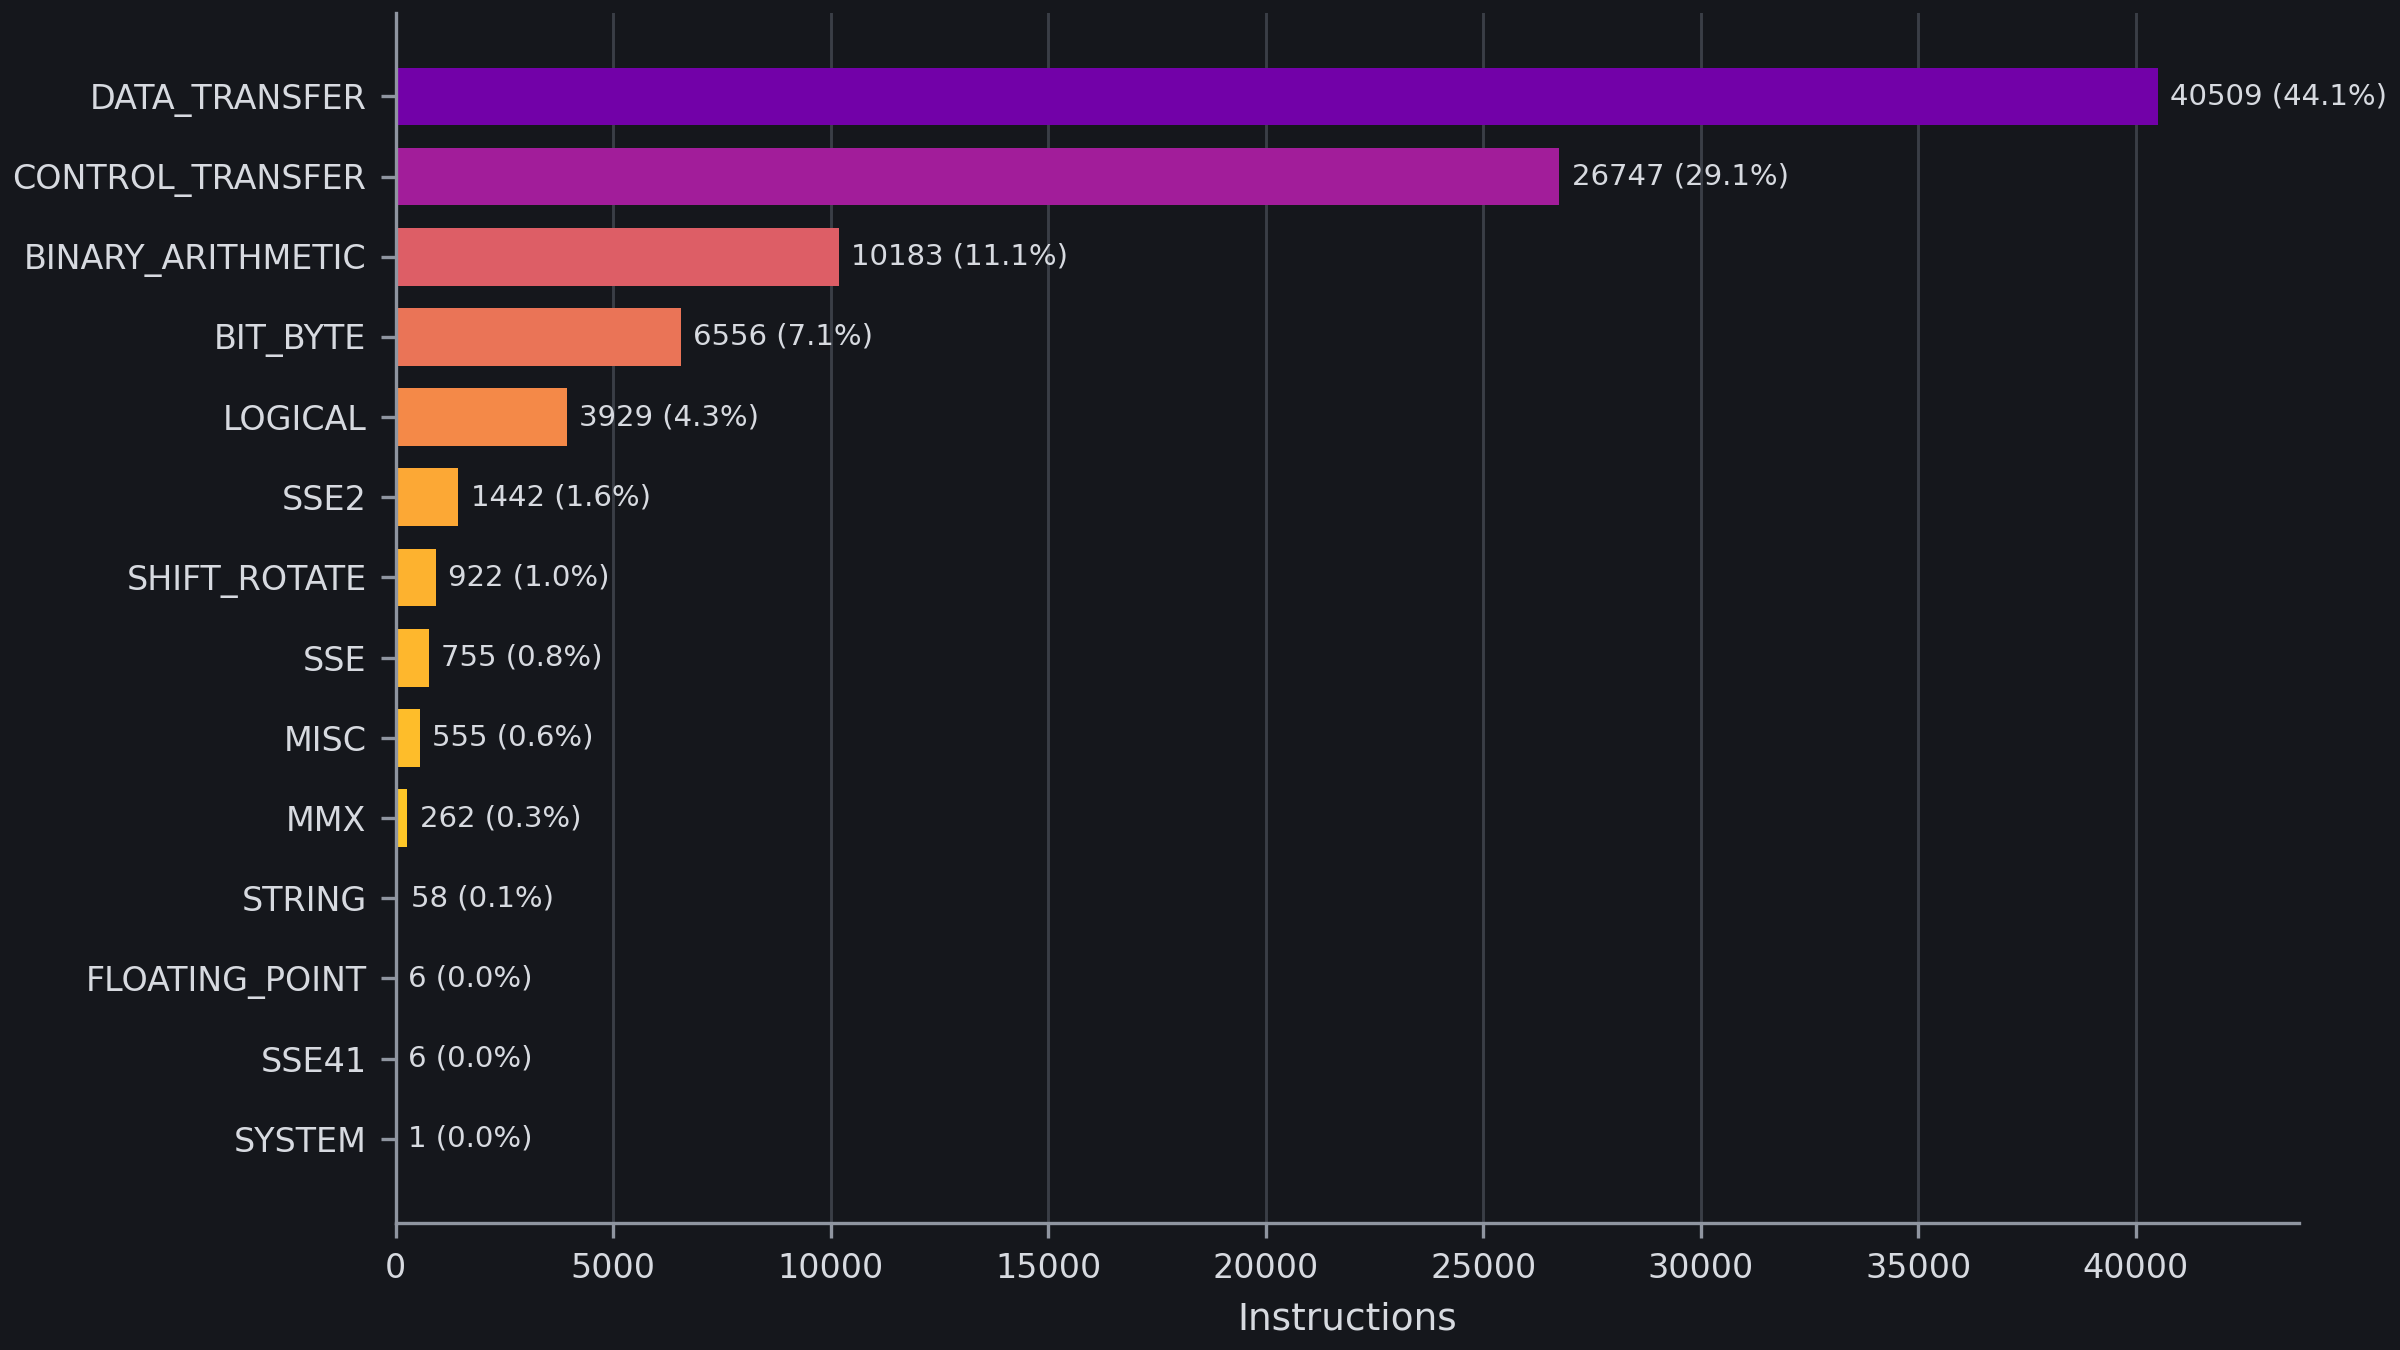
Instruction categories in python3: data movement and control flow dominate.
Roughly 44% of python3’s instructions just move data around, 29% are control transfer, 11% arithmetic. The heavy control-transfer share is the interpreter doing what interpreters do: fetch the next bytecode, jump to its handler, repeat. A binary that did heavy math would push the arithmetic and SIMD categories up instead. The instruction mix is a fingerprint of what a program spends its time on.
Which Instruction Follows Which
Single instructions are one thing; sequences are more telling. The idiom
module counts which instruction follows which, and the picture is
surprisingly rigid.
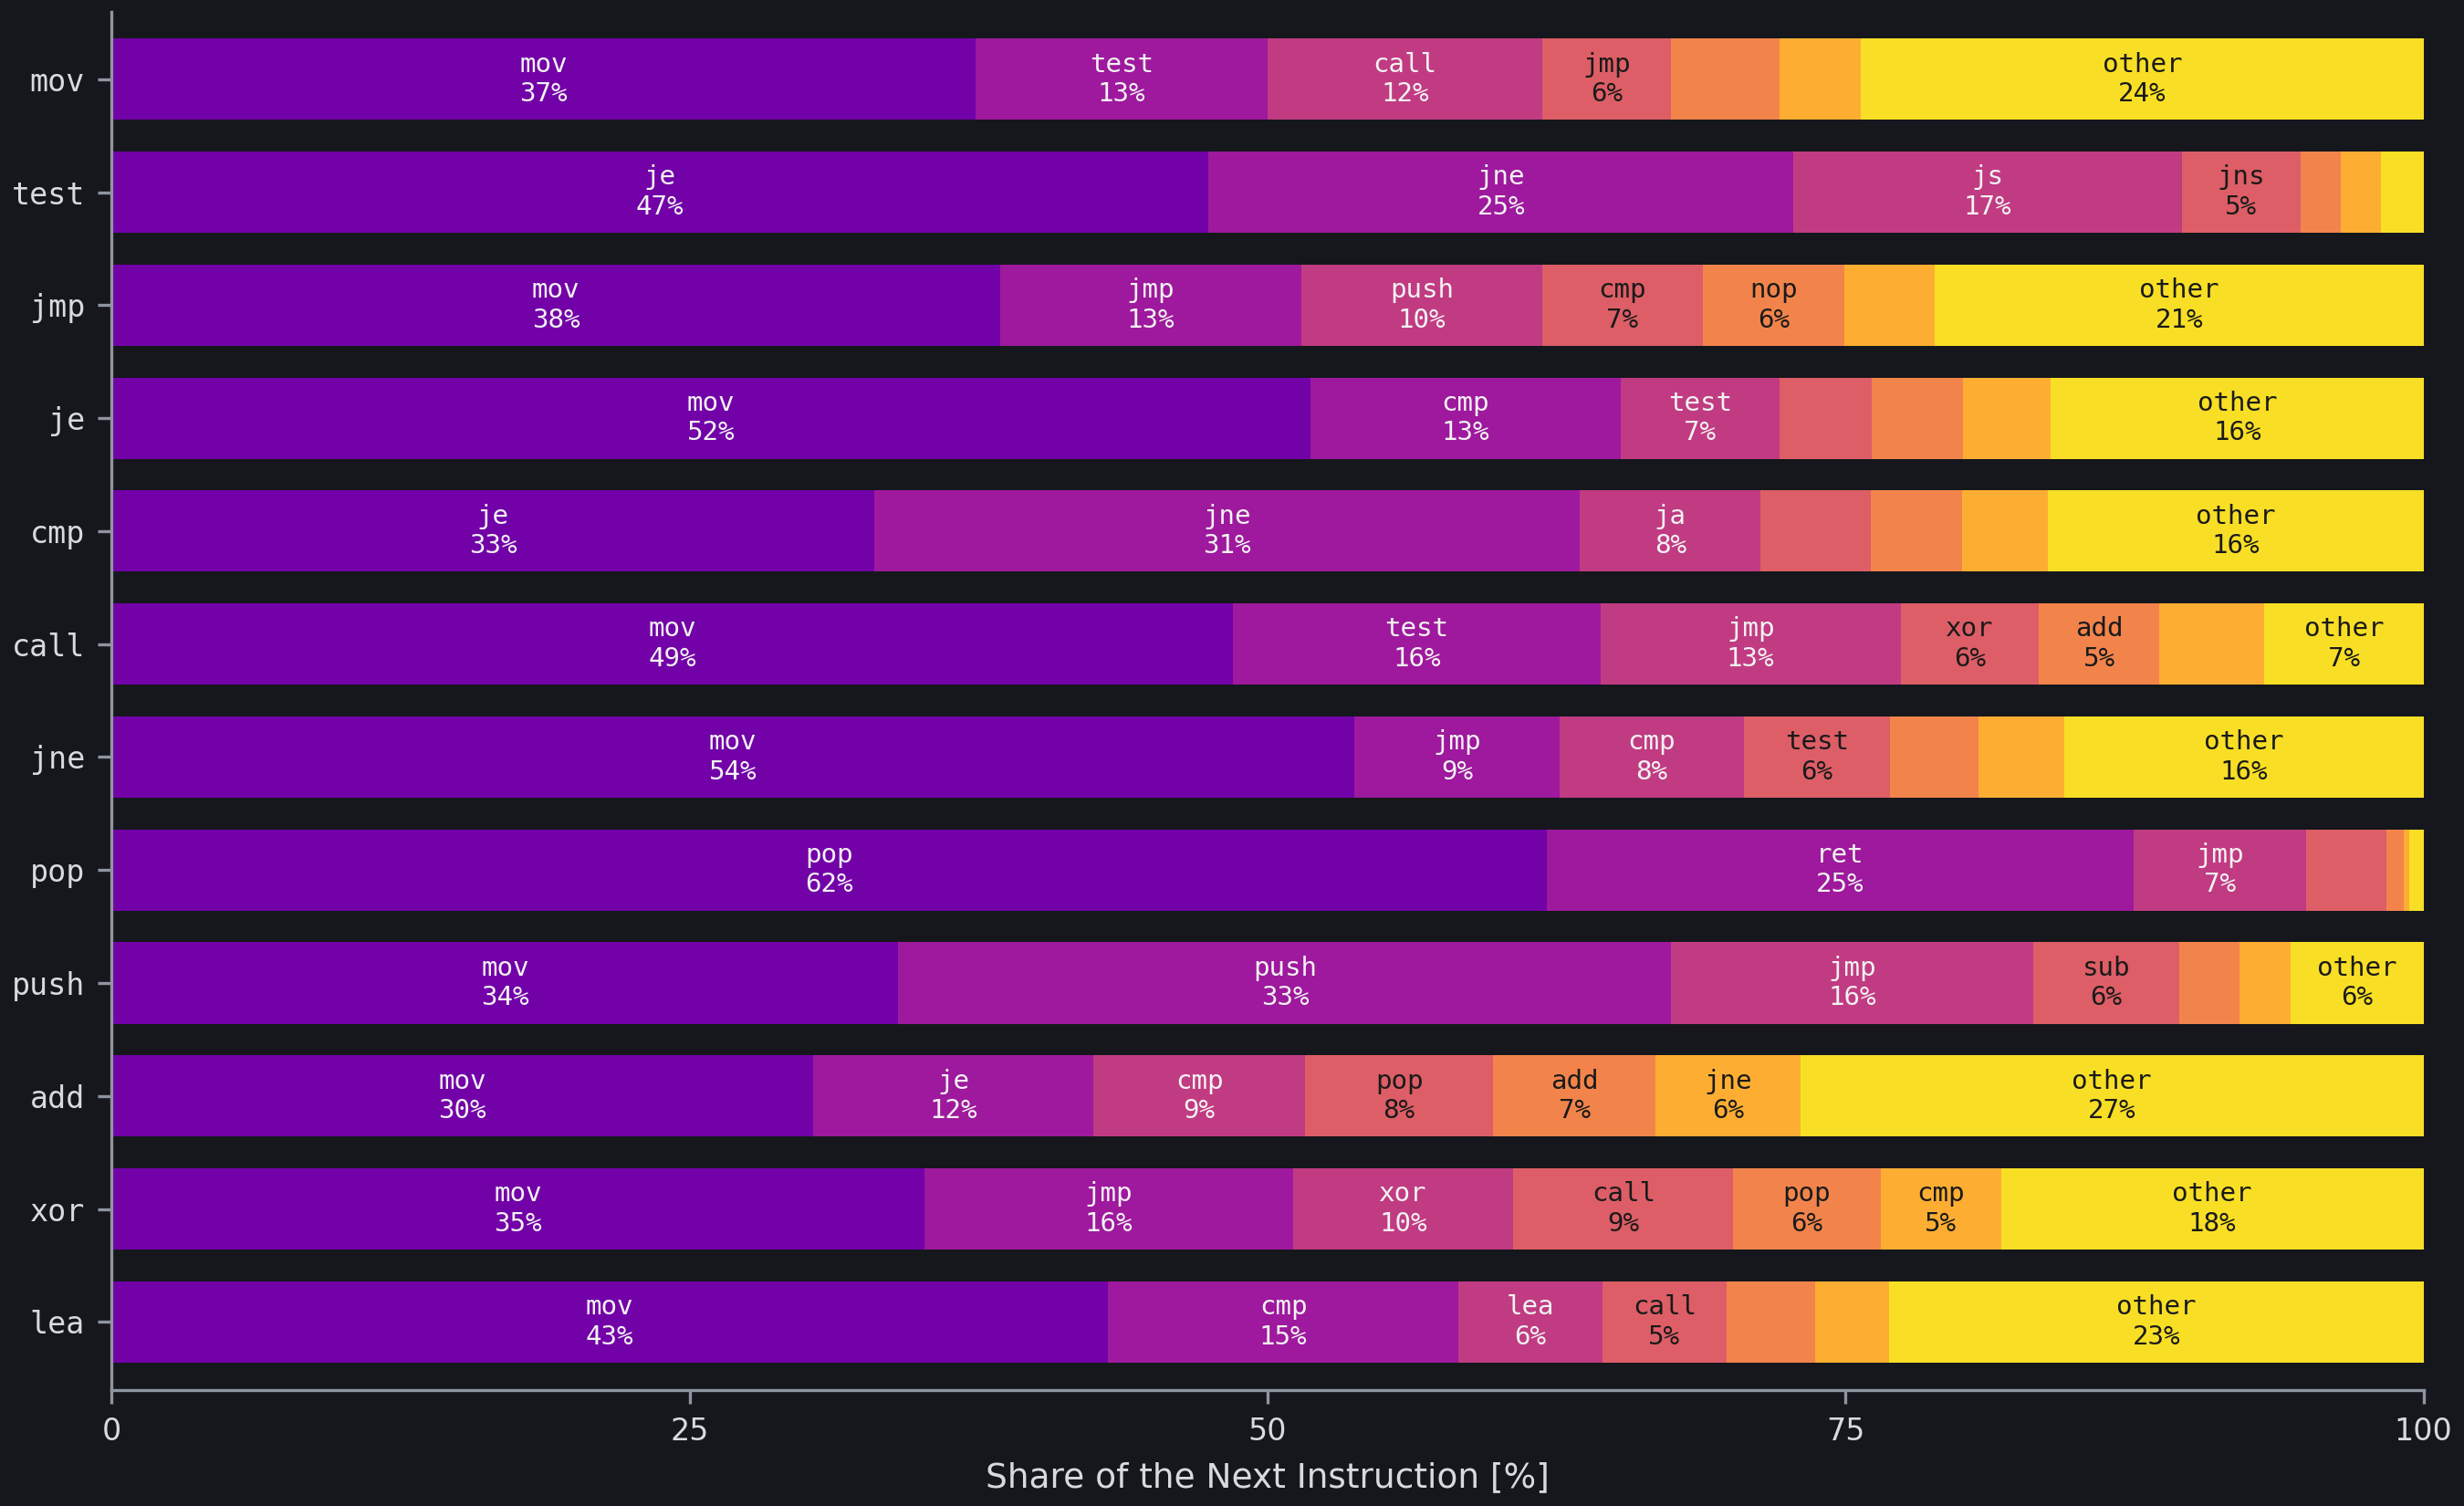
What each instruction is followed by. After test comes a conditional jump; after pop comes another pop.
Read each bar left to right as “after this instruction, here is what comes
next”. After a test, almost half the time comes a je, and another quarter
a jne: a flag check followed by a branch. After a pop comes another pop
62% of the time, the function epilogue unwinding saved registers. These are
not choices a programmer made. They are the fixed grammar the compiler emits,
the same handful of couples over and over.
How Far the Jumps Go
The branch module looks at local jumps, the ones that stay inside a
function. It splits them into forward and backward and measures the distance
in bytes.
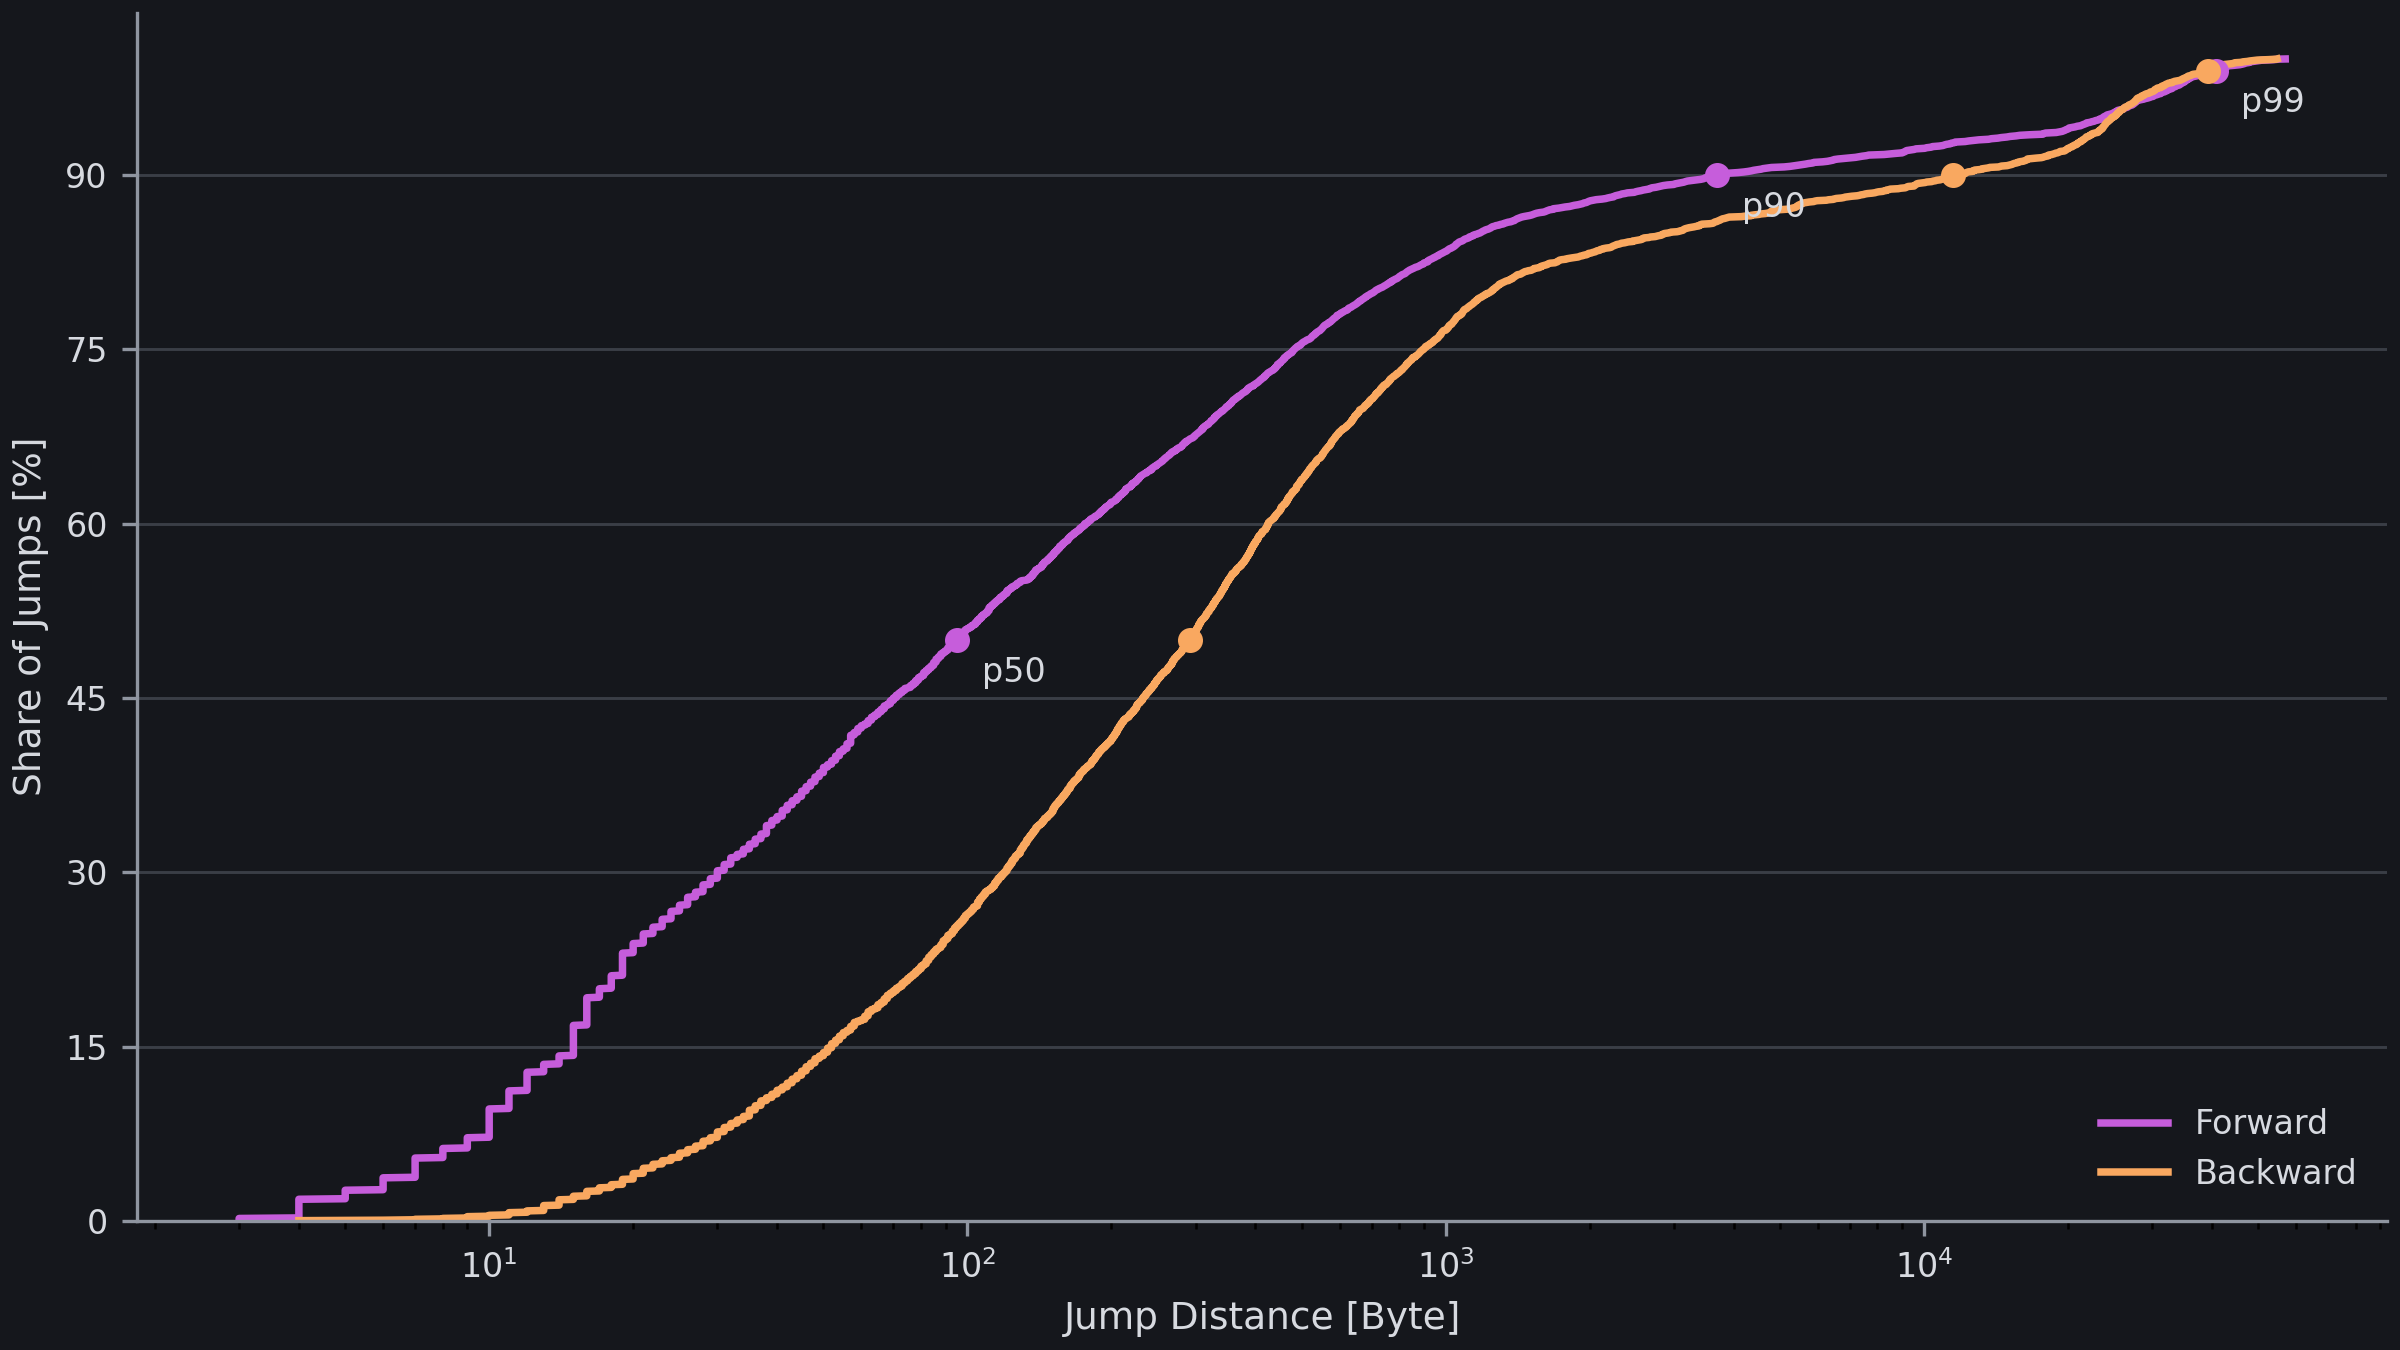
Jump distance as percentile curves, forward and backward. Most jumps are short; a few reach far.
python3 has about 13,000 local jumps, and two thirds go forward. The curves read like a latency plot: half the jumps land within a hundred bytes or so, which matches the intuition that most branches skip a small if-block. The long tail, jumps of tens of kilobytes, comes almost entirely from that one 57 KB interpreter function, where a dispatch can throw you clear across the code.
Who Calls Whom
The call module classifies call sites: direct calls into the binary, calls
out through the PLT into shared libraries, and indirect calls through a
register or memory pointer.
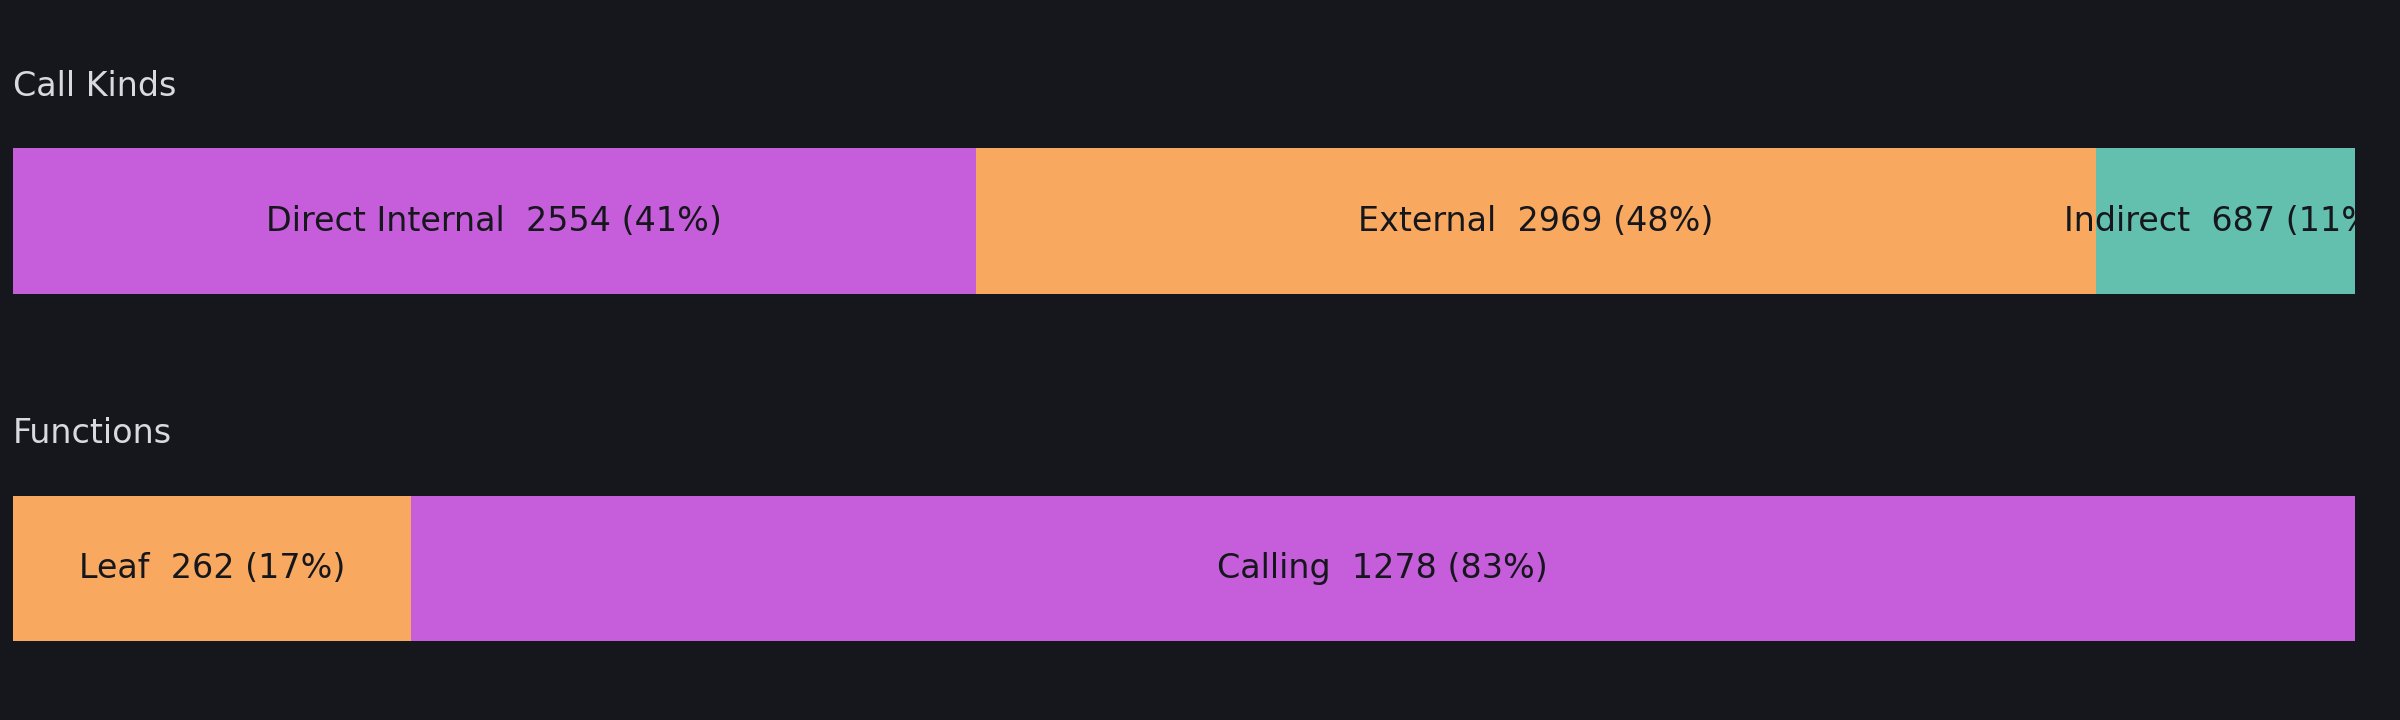
The mix of call kinds, and how many functions are leaves.
Of python3’s 4600 call sites, about 15% are indirect. Indirect calls are function pointers and vtables, the dynamic dispatch that CPython leans on for its type slots. A high indirect share is a signal: it means dynamic behaviour the compiler cannot see through, and it is harder on the branch predictor. About one function in six is a leaf that calls nothing at all.
How Much Stack It Takes
The stack module detects the stack frame each function sets up: static
allocations from a sub $imm,%rsp, and dynamic ones through a register for
variable-length arrays.
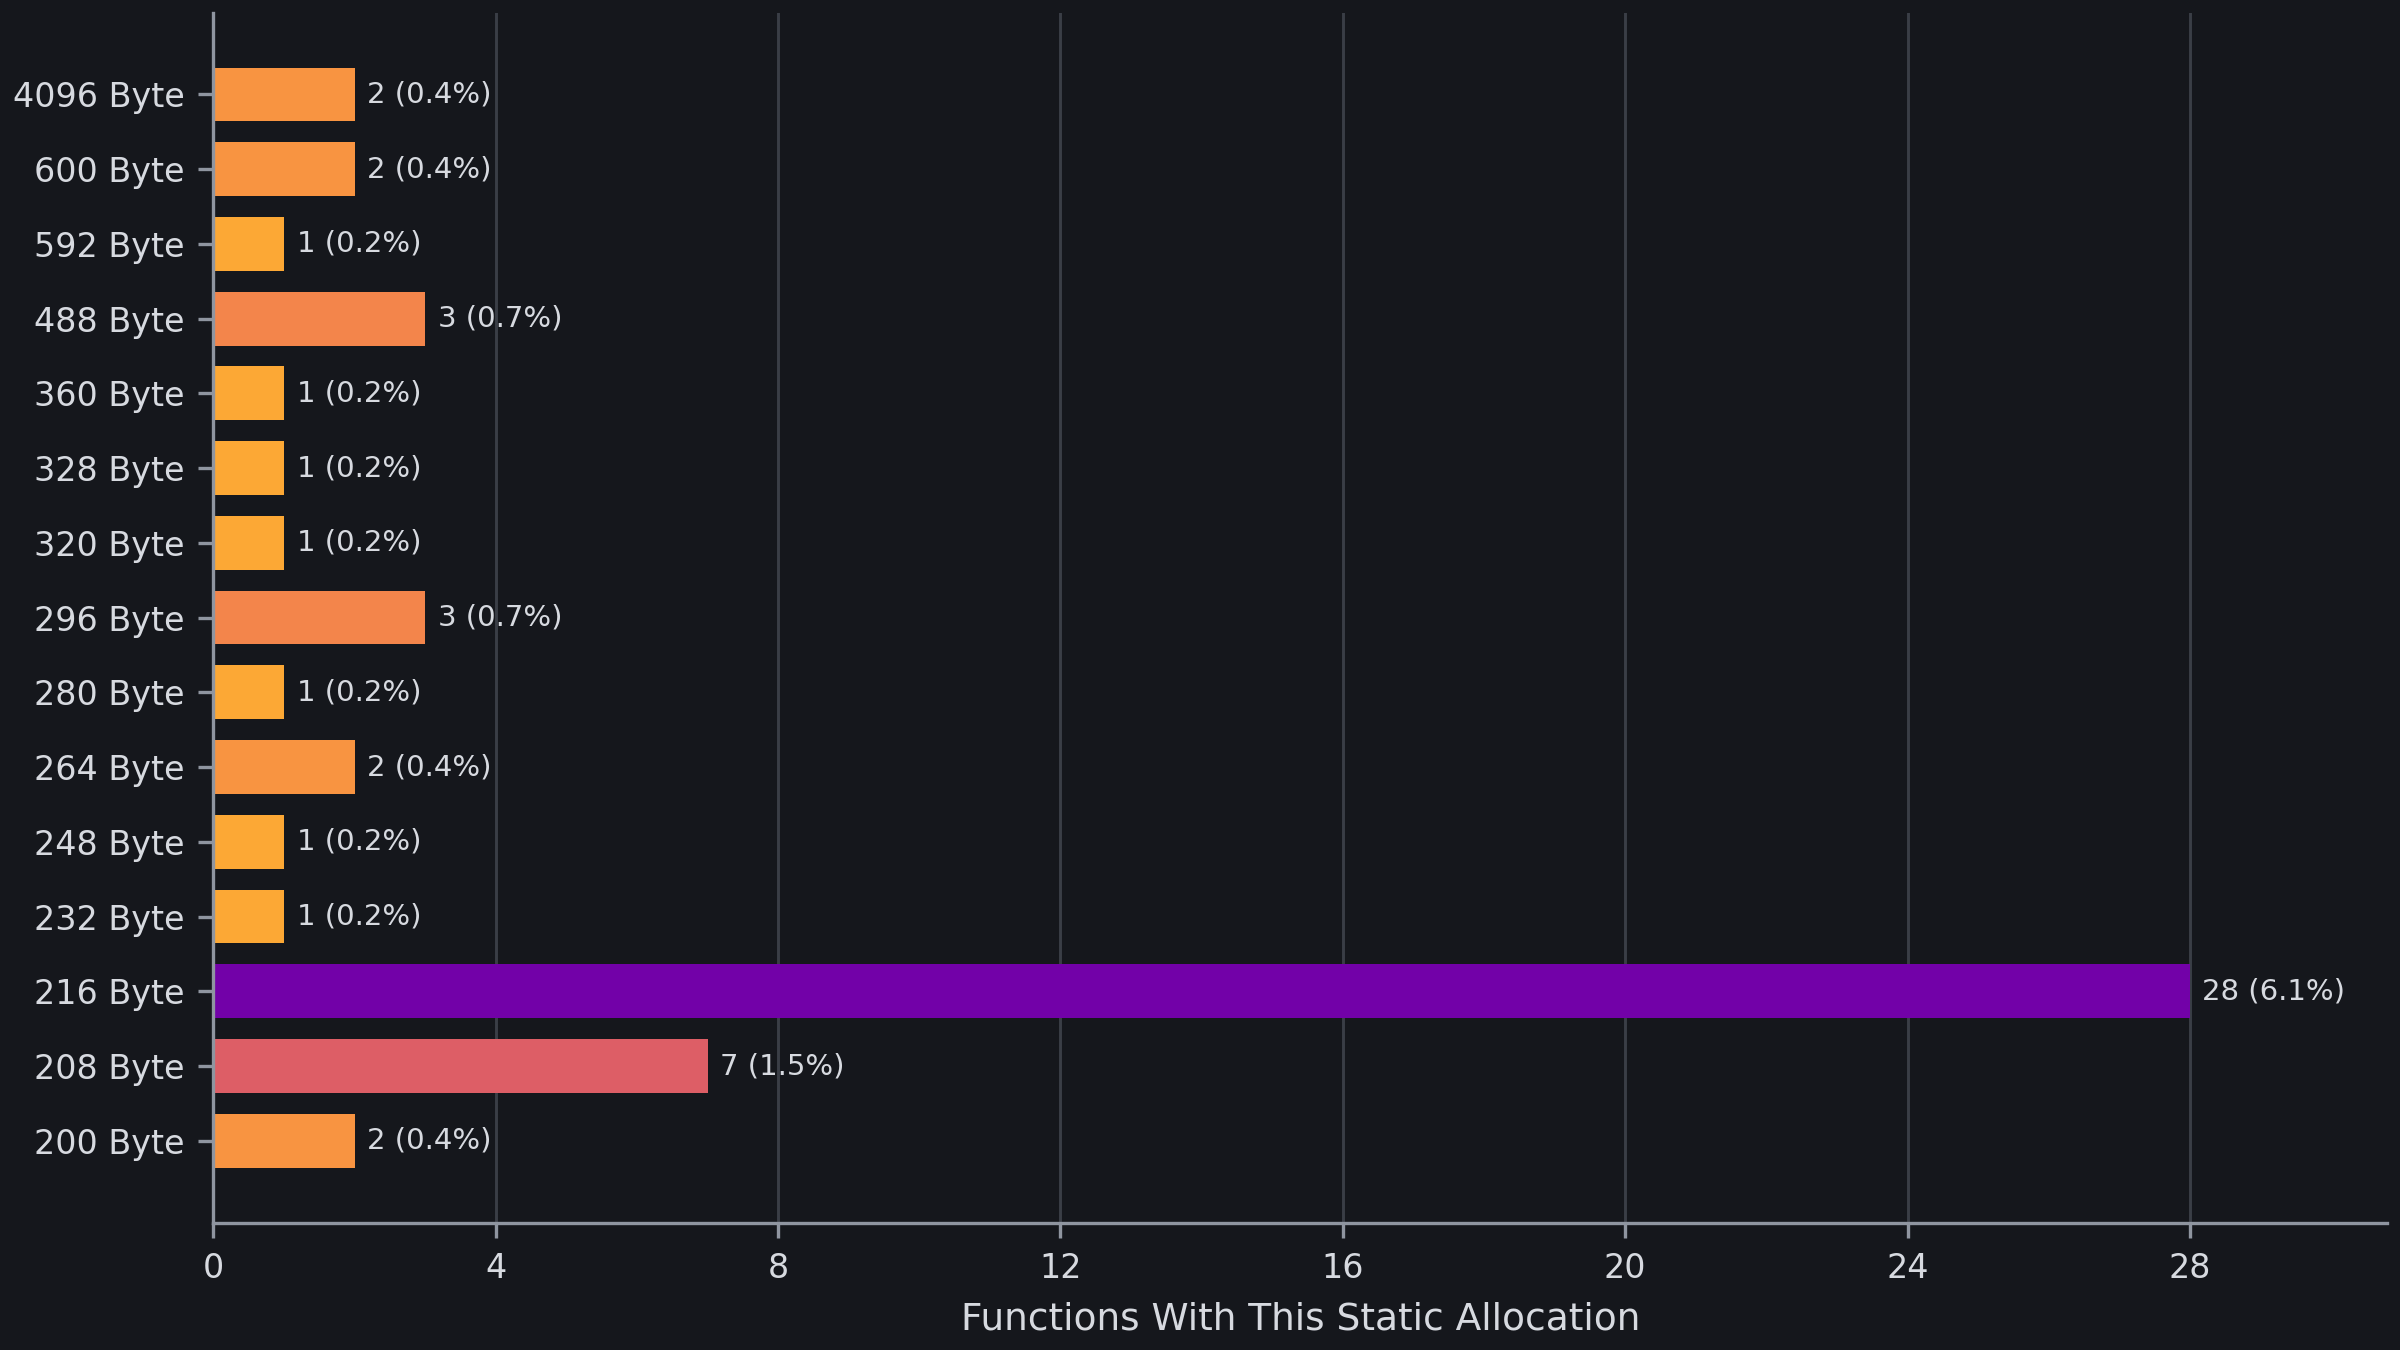
How many functions allocate which exact stack size. The 4096-byte cluster is PATH_MAX buffers.
Only about 30% of functions touch the stack at all; the rest live entirely in
registers. The interesting spike is at exactly 4096 bytes, a whole page,
which almost always means a PATH_MAX buffer sitting on the stack. Seeing
that spike in a binary tells you it does a lot of filesystem path handling.
Locks and Atomics
The atomic module finds synchronization: locked read-modify-write
instructions, memory fences, and spin-wait loops.
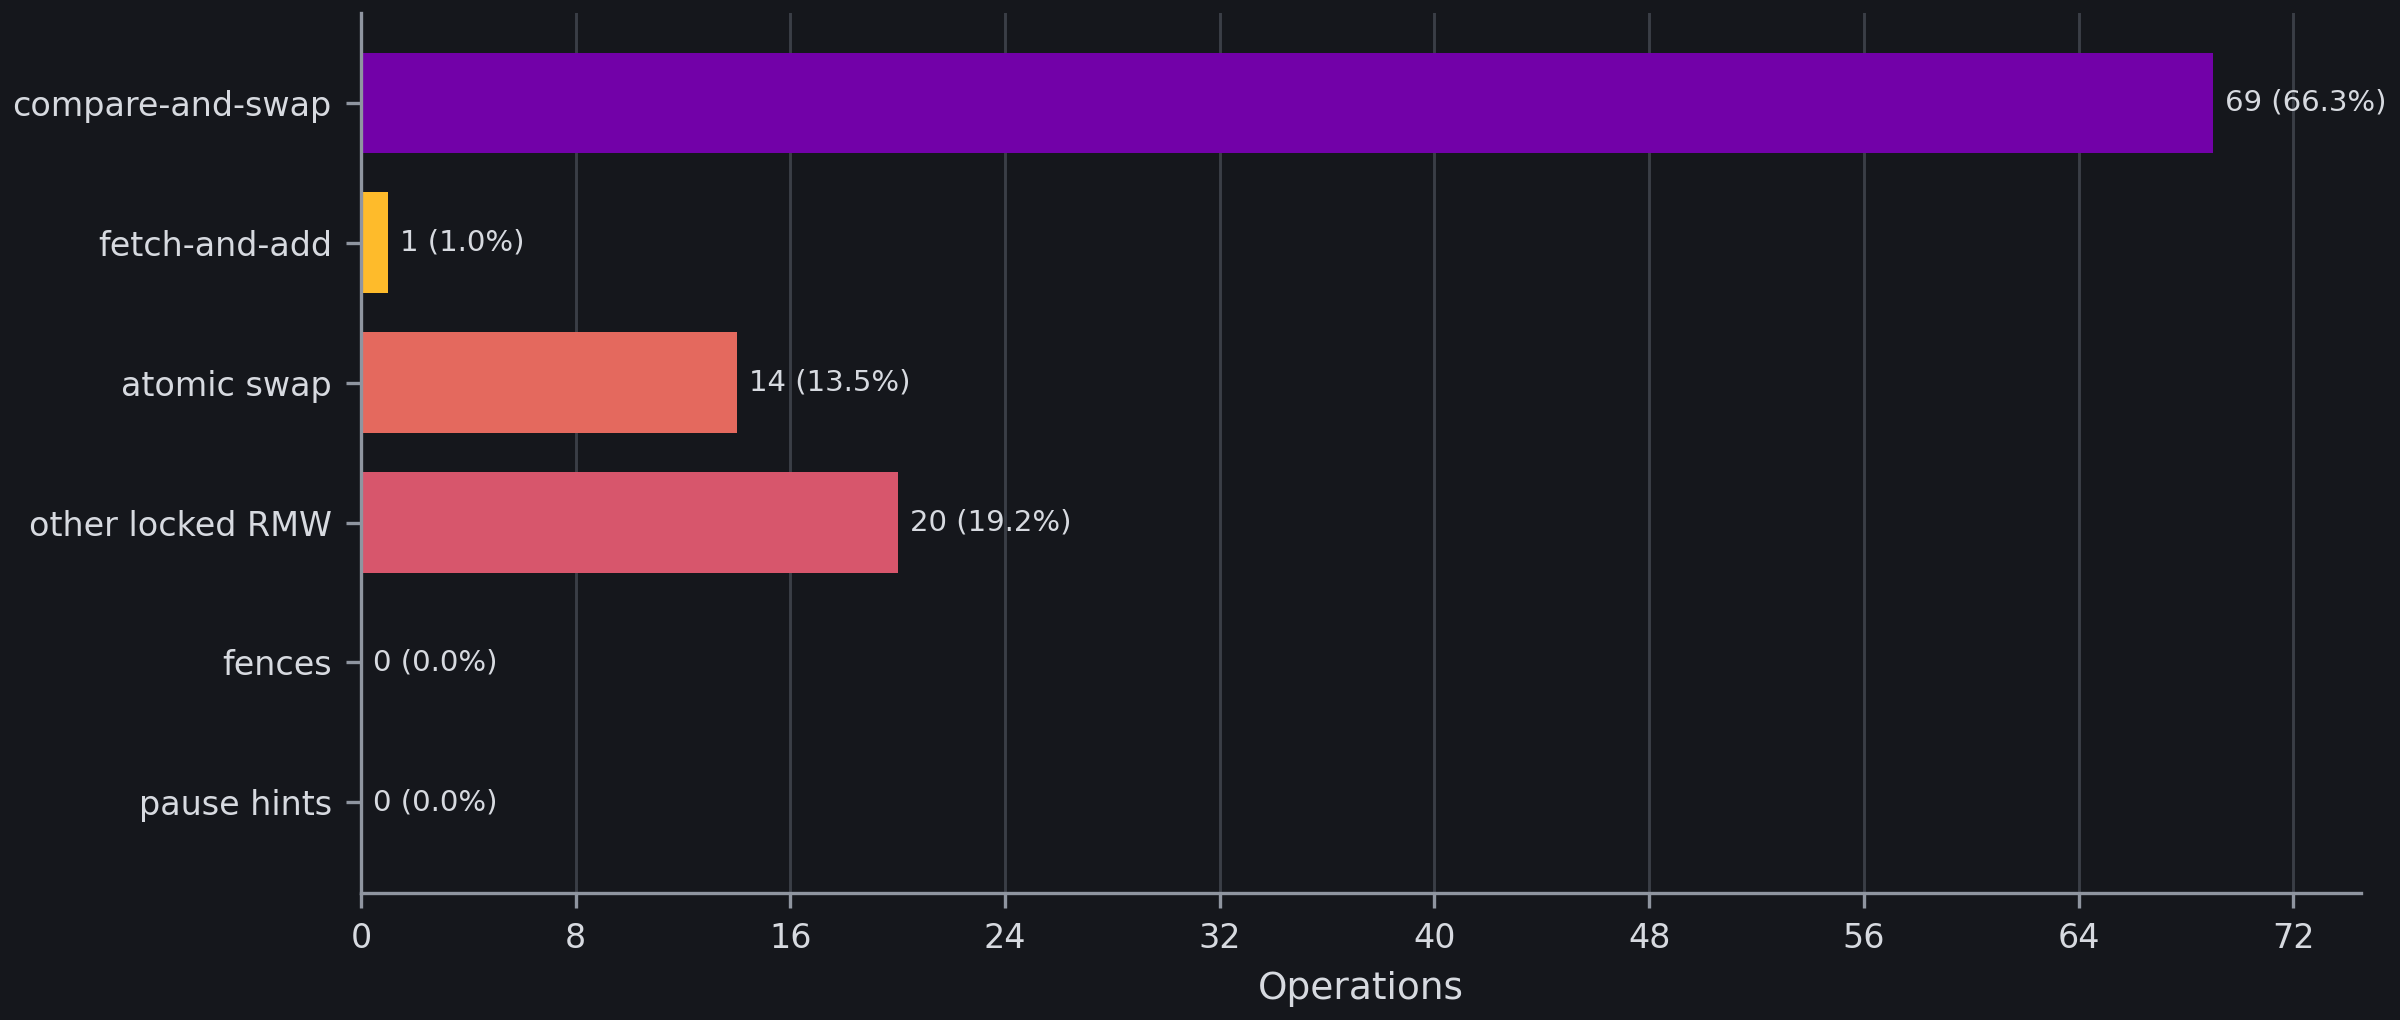
The atomic operations python3 contains, dominated by compare-and-swap.
python3 has 104 locked operations, 69 of them compare-and-swap. That is
CPython’s reference counting and the atomics behind its free-threading work.
There are no spin loops here; a program full of pause-driven spin waits
would look very different, and the module flags those separately.
Hot Code and Cold Code
This is my favourite one. Optimizing compilers move error handling and
unlikely branches out of the way, behind the function’s normal exit, so the
hot path stays dense in the instruction cache. The layout module measures
that split: the path from the function entry to the first ret is the hot
head, everything after it is the cold tail.
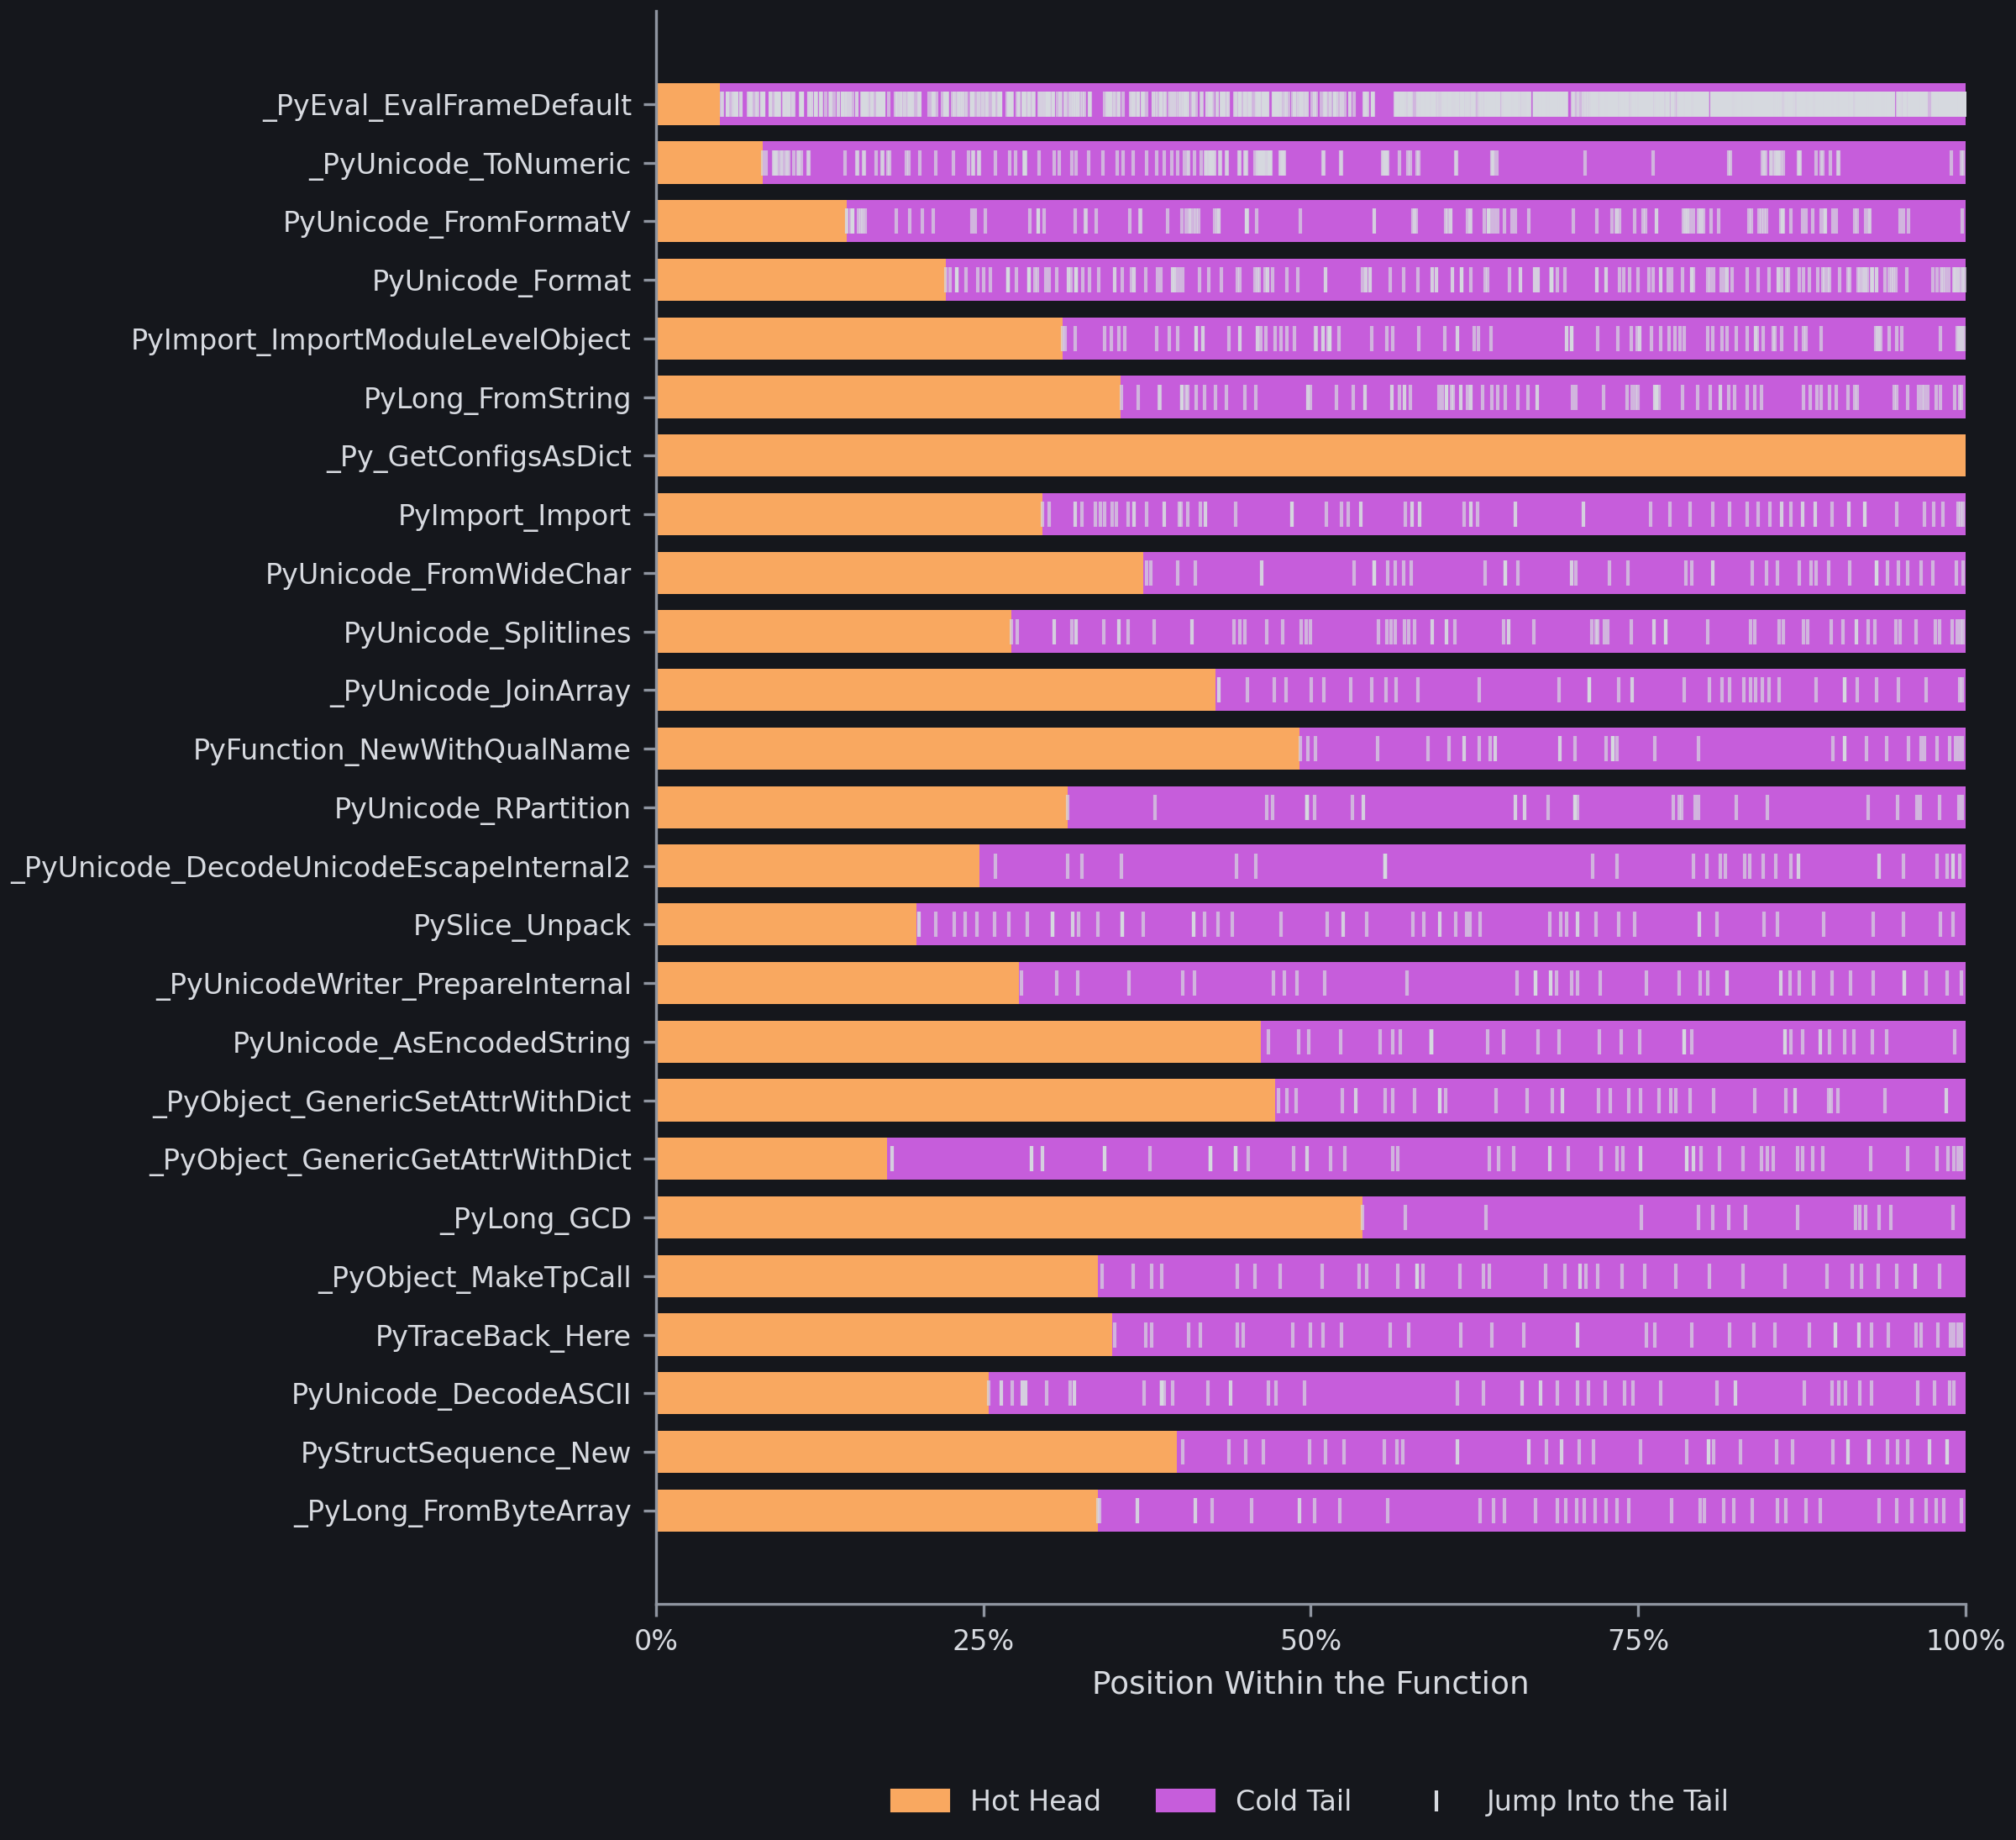
Each row is a function: orange is the hot head, purple the cold tail the compiler pushed to the end. Ticks are jumps into the tail.
Across python3, roughly half of the analyzed bytes are cold. Half. That is code the compiler is betting will (almost) never run, mostly error paths and cleanup. It is a static estimate, not a profile, so it measures the compiler’s intent rather than reality, but the number is a striking way to see how much of a program is there for the unhappy path.
What Mitigations Are Built In
The hardening module checks the security features that show up in the
instruction stream: endbr64 at function entries for Intel CET, and canary
loads from %fs:0x28 for the stack protector.
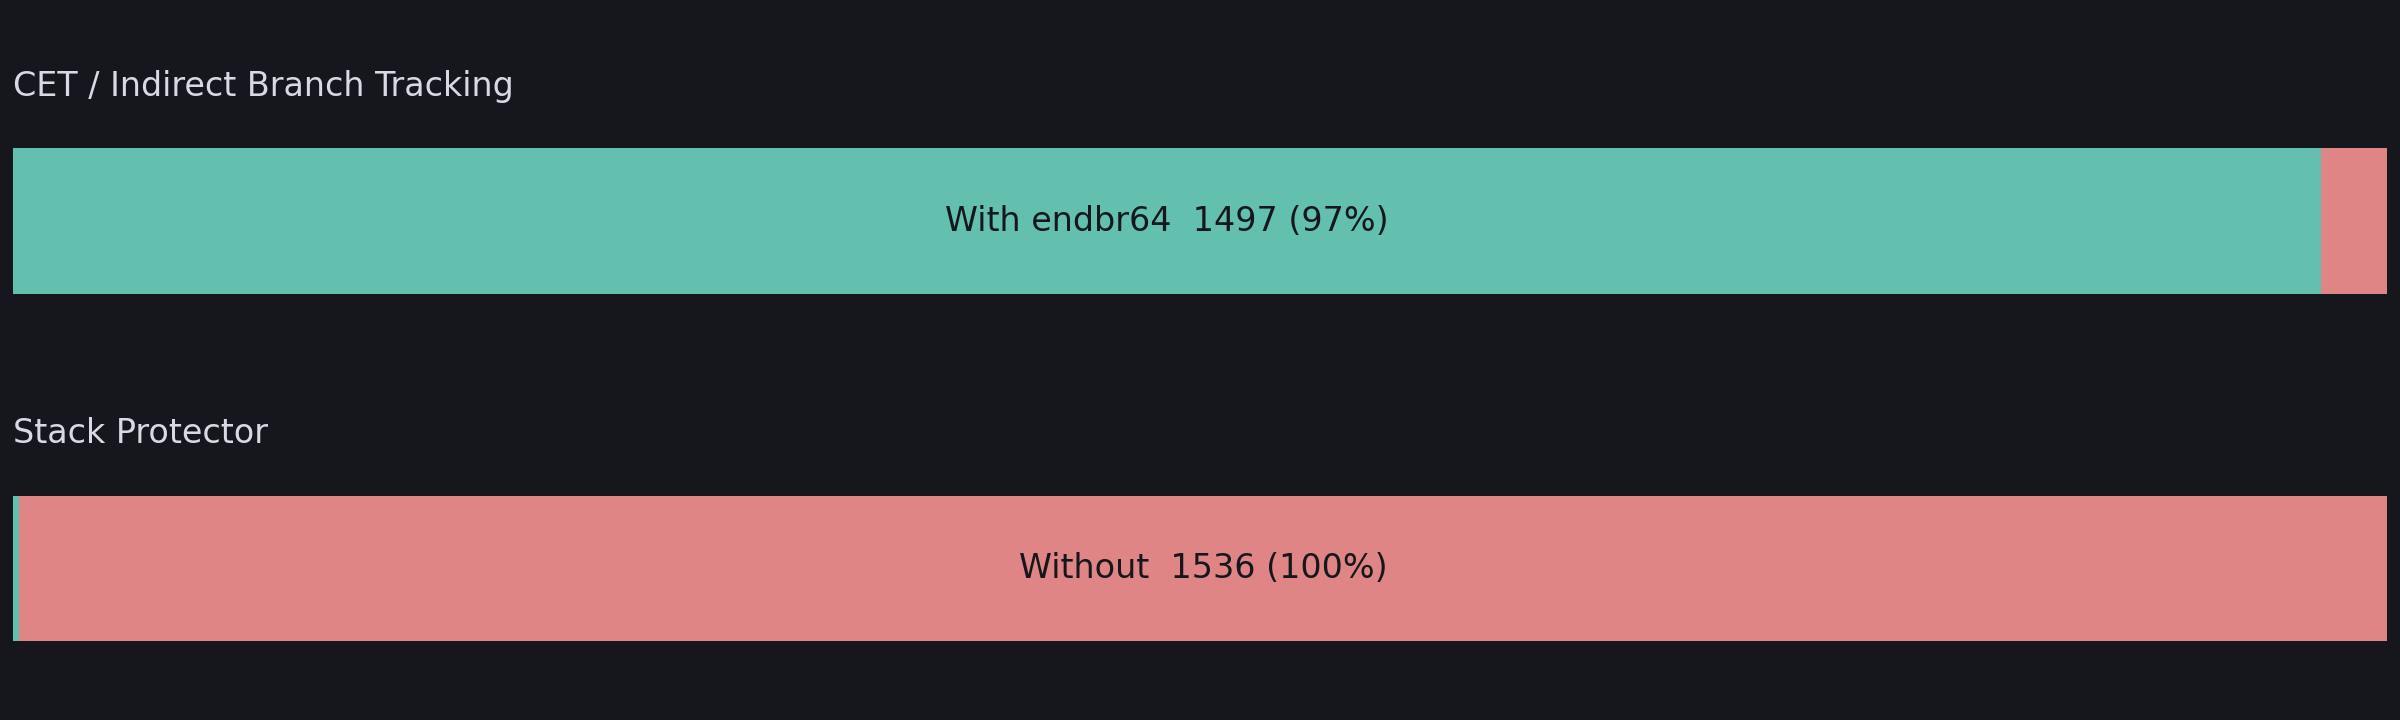
CET and stack protector coverage across python3’s functions.
97% of python3’s functions start with endbr64, so control-flow enforcement
is on. Only 0.26% load a stack canary, which sounds alarming until you
remember that the stack protector only guards functions with buffers on the
stack, and most functions have none. A modern distribution build looks
exactly like this.
Which Registers Get Used
The register module counts every register mention, folding sub-registers
like eax and al into their family.
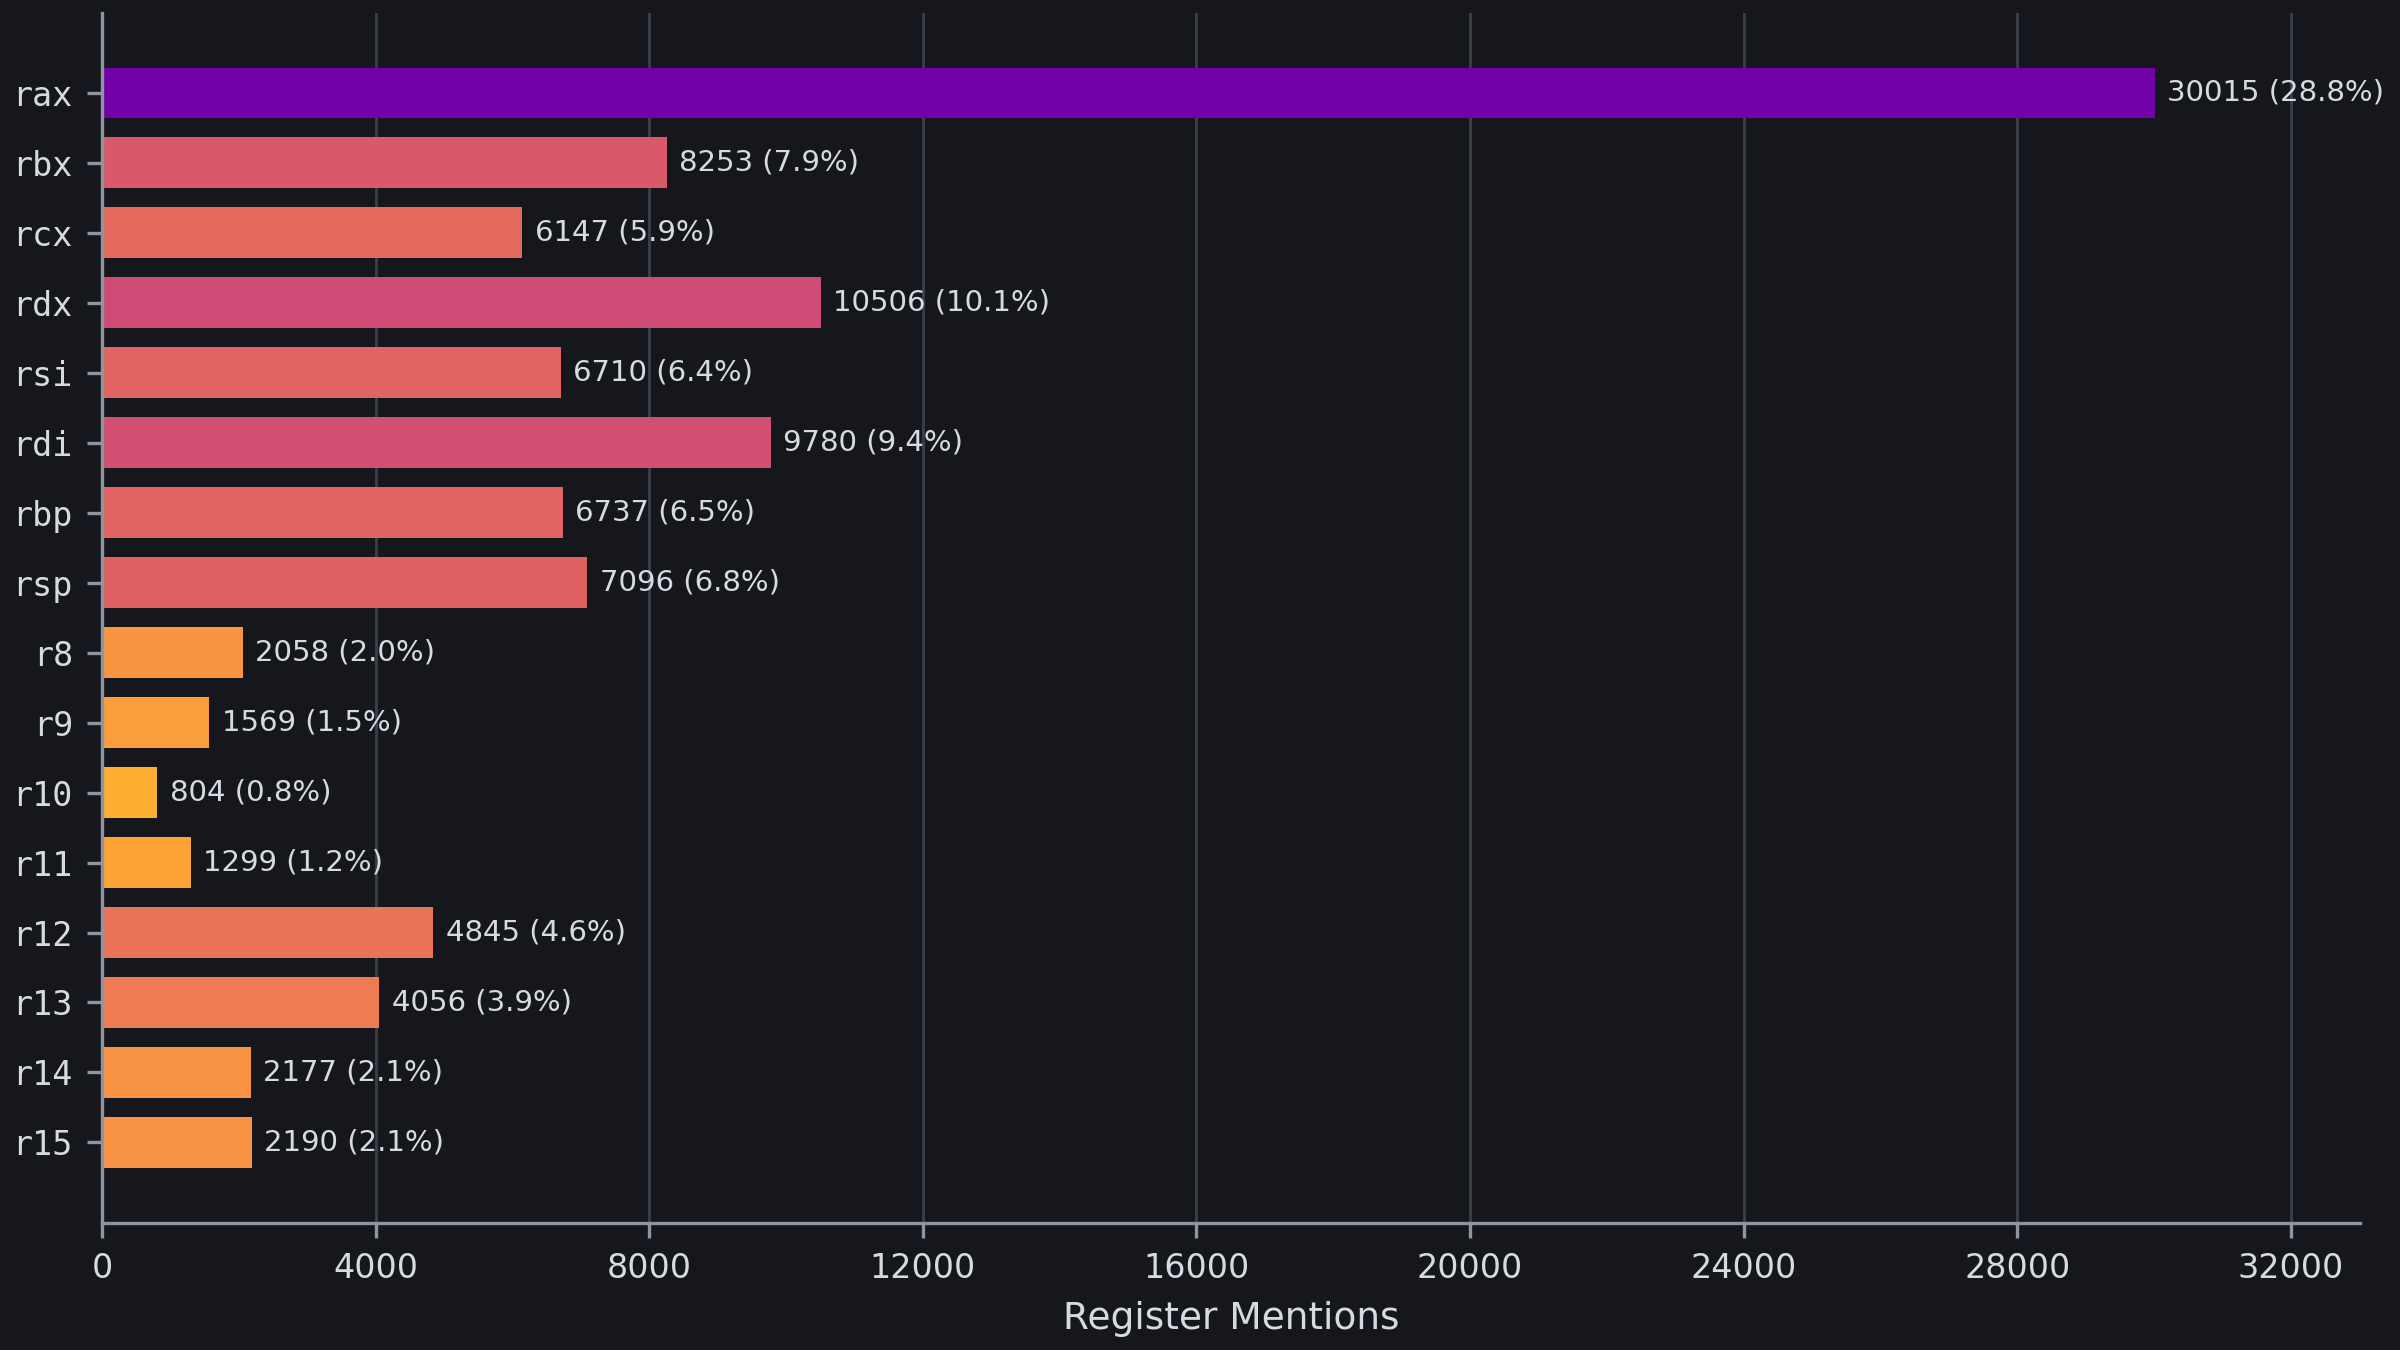
General purpose register usage, in architectural order. rax leads; r8-r15 drop off.
rax alone is 29% of all register mentions, doing double duty as return value
and scratch register. Then come the argument registers, rdi, rsi, rdx.
The sharp drop from rdi down to r8 and above is the compiler avoiding the
REX prefix that the upper eight registers require: reaching for them costs an
extra byte per instruction, so it does not, unless it has to.
The Rest
There are two more modules I will not draw here. info wraps eu-readelf
and file for the linker and loader side of the picture: PIE, RELRO, the
NX bit, RUNPATH, the shared-library dependencies, a checksec-style summary.
And diff compares two builds of the same program and reports what changed,
which functions grew, which instruction categories shifted, useful for
judging what a compiler flag actually did.
Every module can also write its results as JSON with --json-out, which is
the hook for the next thing I want to do: run this across every binary on a
whole system and look at the aggregate. That is a separate post.
Getting It
The tool is Python, needs capstone and pyelftools, and matplotlib only if you
want the graphs. It is at jauu.net. Point it at anything
in /usr/bin and see what your machine is actually made of.